Guide to the land use change update
24 July 2025
The Farm Carbon Calculator has just updated its methodology to allow you to account for past land use change (sometimes called direct or major land use change) in alignment with SBTi Forest Land and Agriculture Guidance (FLAG) and the Draft Land Sector Removals Guidance (LSRG), using the IPCC 2019 methodology. Importantly you only need to account for this if you have had a permanent change, from one of the below land categories to another. For conversion to or from grasslands, this is only considering permanent grasslands. This guide will walk you through the new options under the land use change (LUC) tab on the Calculator and how to update legacy land use change entries.
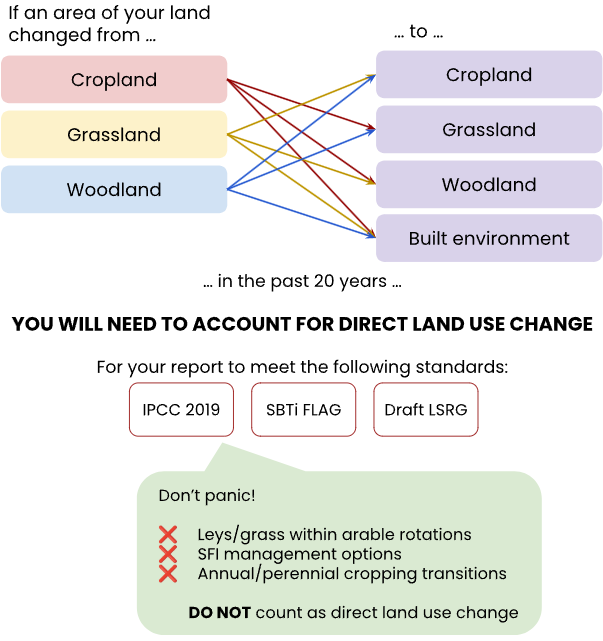
Direct land use change refers to a permanent alteration in the way your land is used. The word direct just means it has occurred on your land and not on land within your supply chain. You need to account for these changes within the past 20 years. Examples include:
- Turning an arable field into permanent pasture or woodland,
- Ploughing up permanent grassland and planting crops,
- Converting farmland into a building site or buildings, where soil is paved over,
- Turning a woodland into a perennial agroforestry system.
Changing land uses matters because it affects the amount of carbon stored in soils and biomass, which in turn affects greenhouse gas emissions. When a change in land use from a high carbon storing land type, such as a woodland, is cleared for growing crops, carbon stored in the trees and soils is lost to the atmosphere as CO2. When soil carbon is lost, this also causes N2O emissions, because this changes the C:N ratio in the soil and microbes mineralise more nitrogen.
Importantly, the change in carbon stored in soils and biomass can take years to reach a new carbon balance in the ecosystem. The time period of the transition is usually 20 years, before the land can be categorised as the new land category (IPCC 2019).
You might have changed how you manage your land over the last 20 years, however management change does not fall under 'direct land use change'. Some examples of land management that are not considered land use change are:
- Sowing temporary, rotational grasslands (for example rotational herbal leys),
- Converting annual cropland to perennial cropland,
- Converting part of your cultivated land into temporary SFI agreements, such as planting legume fallows, flower or grass strips, herbal leys or winter cover crops (although these practices may influence which level of inputs you choose for estimating soil organic carbon stocks on cropland, see table 2).
Temporary changes, like putting a rotational grassland ley in for a few years is still categorised as cultivated land, which falls under the broad category of cropland. You can still account for management practices such as mowing, grazing or harvesting temporary grasslands under Crops > Green manures, temporary grasslands and cut forages . On the other hand, if you were to convert that cropland into permanent pasture, woodland or the built environment then it would count as direct land use change.
Additionally, converting annual cropland to agroforestry (e.g. silvopasture, silvoarable) or other perennial systems (e.g. orchards, vineyards, short rotation coppice) is still categorised as cropland as per IPCC guidance (2019) and therefore doesn’t constitute as land use change. We would instead recommend entering the information of what perennial crop you are growing under the Crops tab to account for the emissions when returning crop residues to the soil. If you want to model potential carbon removals made by the woody biomass of the perennial plants, you can also enter them under the Sequestration tab.
To log any land use change, you will be asked on the ‘Edit report details’ page when setting up your report:
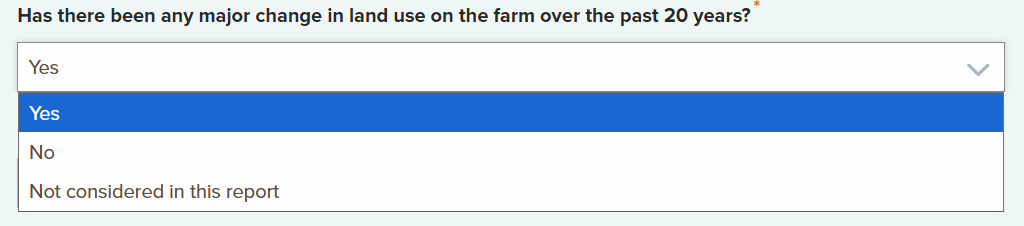
If yes, tick the box, then you will need to select a climate region to progress. This is because the UK spans two of the IPCC climate regions. Read the next drop down to help with choosing the most appropriate option.
Each section is collapsible. Some tables are hidden by default to reduce scrolling — just click "view table" or the arrow to expand.
Climate type
You will be asked to choose a climate region if you have indicated that there has been land use change within the last 20 years. The options are:
- Cool Temperate Moist
- Warm Temperate Moist
See the map below where IPCC climate zones are overlaid on a map of the UK. You can zoom in on the UK or type your post code into the search bar at the top. You can also adjust the opacity of the IPCC climate layer under Layers > and slide the toggle to the right to view the location better.
This embedded map is provided via a public Google Earth Engine App and uses climate zone data from the IPCC. Map hosted and maintained by [philipaudebert].
*There is an area covering Colchester and Southend on Sea that is currently categorised as Warm Temperate Dry by IPCC 2019. We suggest users should use Warm temperate Moist for any farms in this location because SOC stocks reduce drastically within the Warm Temperate Dry category which is used for parts of Southern France, Spain and Northern Africa.
Soil type
On the land use change tab, you will be asked to choose a soil type.
The IPCC has categorised soils into six major types:
- High Activity Clay (HAC) Soil
- Low Activity Clay (LAC) Soil
- Sandy Soils
- Spodic Soils
- Volcanic Soils
- Wetland Soils
Multiple soils can be categorised under these 6 types. By identifying your soil type as per the World Reference Base for Soil Resources (WRB) classification you can identify your IPCC soil type.
Use the map below to identify what WRB soil classification your land is on. You can enter your post code or zoom in and click on a point. To find your IPCC soil type, use the table below to match your WRB soil classification to the IPCC category. (Note the UK does not have any Volcanic soils.)
Contains UKSO materials, © UKRI/BGS (2025). Used under Open Government Licence.
If the UKSO map is not working for Scottish soils, try the map here:
Open Scottish Soils MapWRB soil classifications are mapped to the IPCC 2019 mineral soil types in the table below:
| IPCC Soil Class | WRB Classifications | Definition |
|---|---|---|
| High Activity Clay (HAC) Soil | Leptosols, Vertisols, Kastanozems, Chernozems, Phaeozems, Luvisols, Alisols, Albeluvisols, Solonetz, Calcisols, Gypsisols, Umbrisols, Cambisols, Regosols, Fluvisols | Soils with HAC minerals are lightly to moderately weathered soils, which are dominated by 2:1 silicate clay minerals. |
| Low Activity Clay (LAC) Soil | Acrisols, Lixisols, Nitisols, Ferralsols, Durisols, Stagnosols, Planosols | Soils with LAC minerals are highly weathered soils, dominated by 1:1 clay minerals and amorphous iron and aluminium oxides. |
| Sandy Soil | Arenosols | Includes all soils (regardless of taxonomic classification) having >70% sand and <8% clay, based on standard textural analyses. |
| Spodic Soils | Podzols | Heavily leached soils, where rainwater washes nutrients downwards, creating acidic, nutrient-poor top layers. Iron and organic matter accumulate below, forming a dark or reddish layer. |
| Volcanic Soils | Andosols | Soils formed from volcanic ash. Over time, the ash forms a special type of soil containing minerals called allophanes. |
| Wetland Soils | Gleysols | Soils with restricted drainage that leads to periodic flooding and low-oxygen (anaerobic) conditions. |
| Organic Soils (Not mineral soils) |
Histosols | Also known as peat, these organic soils contain over 12–18% organic carbon by weight. They are typically waterlogged and found in wetlands, but may also occur in drained or cultivated areas. If land use change occurs on organic soils, use the organic soils section of the calculator instead of the mineral soil land use change tab. |
Note: Assignment of the WRB soils Stagnosols, Fluvisols and Planosols to the IPCC soil types is per the research paper by Sinitamobirivoutin et al., 2024, as these are omitted from IPCC 2019.
The main land use categories are Cropland, Grassland, Woodland, and the Built environment. But further subcategories, management and inputs practices on these land types are provided.
| Land Use Categories | Subcategories | Examples |
|---|---|---|
| Grassland | Includes areas of permanent pasture, cut for silage, hay lands, and rangelands. | |
| Woodland | Includes areas of woodlands (with little to no management). Options include broadleaf, conifer, or mixed woodlands <20 years old and >20 years old. | |
| Cropland | Cultivated | Land predominantly farmed with annual crops and/or temporary grasslands for over 50 years. |
| Set Aside | Areas of annual cropland set aside (e.g., conservation reserves) or idle cropland revegetated with perennial grasses. | |
| Perennial or tree crop | Includes orchards, vineyards, short rotation coppice, silvoarable, and silvopasture areas. | |
| Built Environment | Capped soil (paved over soil) | Land converted to roads, car parks, or buildings, where soil is capped or paved over. |
1For each woodland type, two age groups are provided to give a more accurate estimate of biomass. Select the >20 year woodland options in the before land use change category and enter a rough estimate of how old the woodland was when it was cut down. Select the <20 year woodlands values in the after land use change category to accurately model biomass gain of a younger woodland.
Management and inputs practices for different land types are given to get a better estimate of soil organic carbon (SOC) stocks. Choose whichever option has mostly applied to the parcel of land over the past 20 years for the before and after land use change.
| Land Use Category | Management | Examples |
|---|---|---|
| Cropland > Cultivated | Full tillage | Substantial soil disturbance (e.g. full inversion or frequent tillage operations). At planting, little (<30%) of the surface is covered by crop residues. |
| Reduced tillage | Reduced soil disturbance (usually shallow till and without full soil inversion). Normally leaves surface with >30% coverage by residues at planting. | |
| No-tillage | Usually involves direct seeding without tillage, with only minimal soil disturbance. Herbicides are typically used for weed control. | |
| Grassland | Managed, non-degraded | Low or medium intensity grazing, or periodic cutting and removal of vegetation, without significant improvements like fertilisation or irrigation. |
| Severely degraded | Major long-term loss of productivity and vegetation cover due to mechanical damage or severe soil erosion. | |
| High intensity grazing | High intensity grazing (or cutting) with vegetation composition changes and possibly productivity shifts, but not severely degraded. | |
| Improved | Sustainably managed with moderate grazing or cutting, and has received at least one improvement (e.g. fertilisation, species improvement, irrigation). |
| Land Use Category | Inputs | Examples |
|---|---|---|
| Cropland > Cultivated | Low | Where crop residues are removed, fallow periods are common, or low-yielding residue crops are grown without added fertiliser or nitrogen-fixing plants. |
| Medium | When the majority of crop residues are returned to the soil or, if residues are removed, manure is added instead. Also includes fertiliser use or growing nitrogen-fixing crops in rotation. | |
| High without manure | Includes returning significantly more crop residues than medium input, alongside practices such as growing high-residue crops, green manures, cover crops, improved fallows, irrigation, or frequent perennial grasses in rotations—without manure application. | |
| High with manure | Same as high without manure but also includes regular manure addition. | |
| Improved Grassland | Medium | Has received at least one improvement: fertilisation, organic amendment, irrigation, planting more productive varieties, liming, or seeding legumes. |
| High | Has received more than one improvement from: fertilisation, organic amendment, irrigation, planting more productive varieties, liming, and seeding legumes. |
Note: FCC do not model changes in these management or input practices on their own e.g. full -> reduced tillage, because at a whole farm scale data input can become unmanageable and is increasingly uncertain using tier 1 assumptions and data.
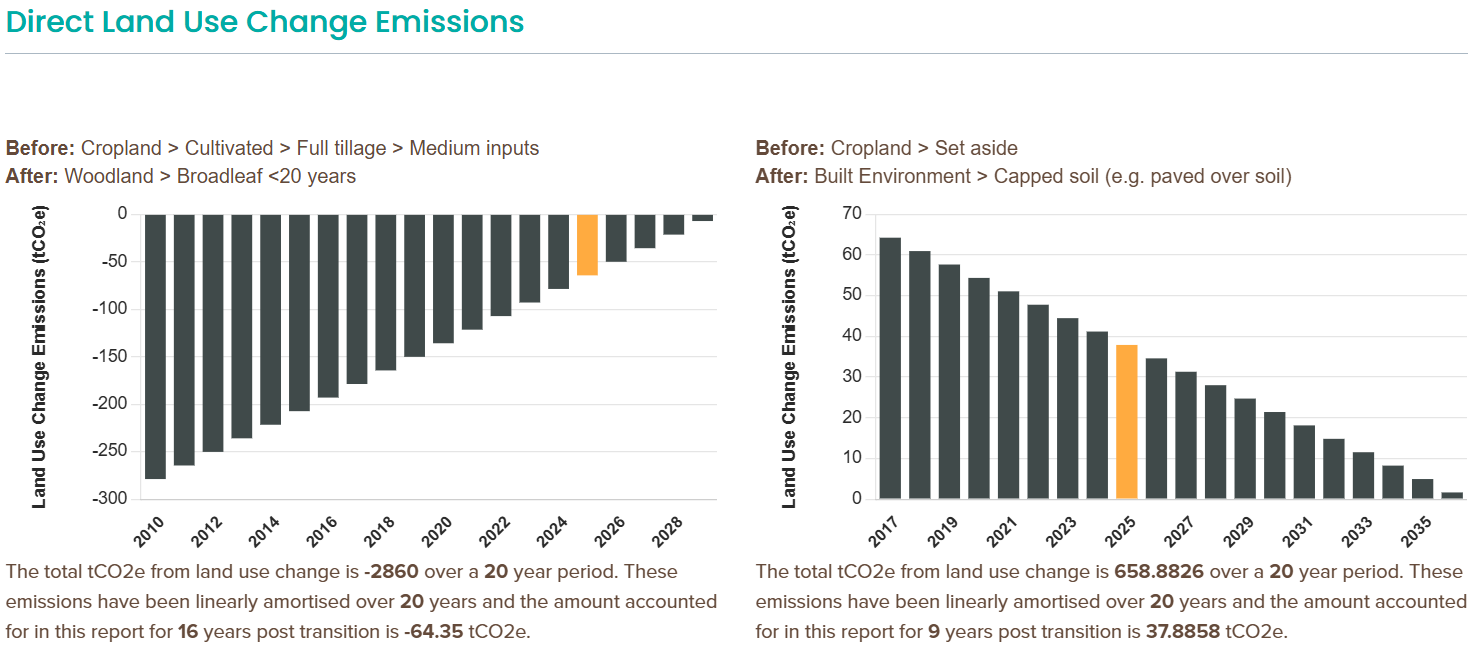
Depending on the area and the land use change, these emissions or removals can be large. The FCC calculates the total emissions for the transition and discounts these emissions linearly over a 20 year period, see diagram below.
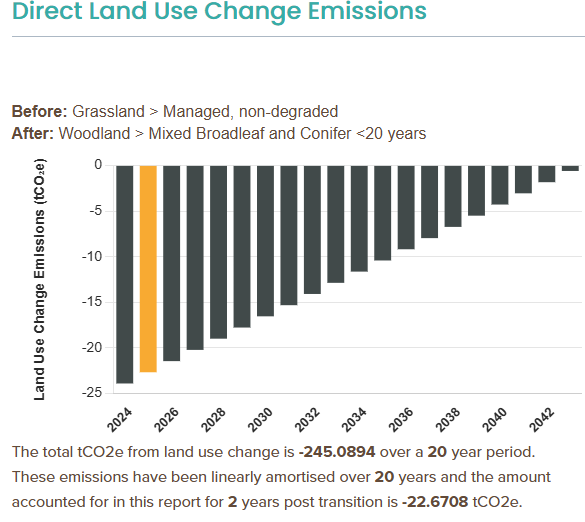
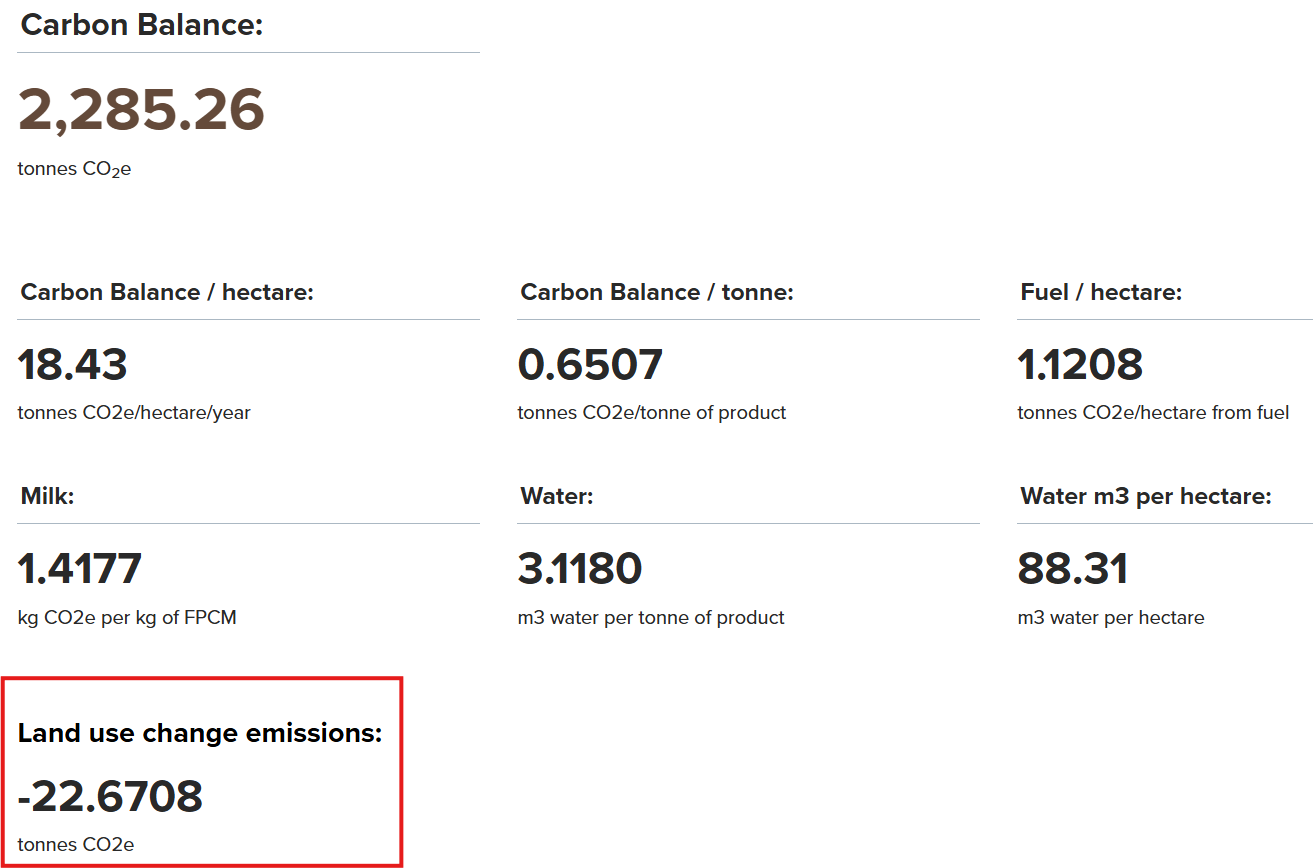
You will account for the largest portion of emissions or removals (9.75%) in the year the land use change occurred and this will decrease each year (by 0.5%) over the next 20 years. However, these emissions/ removals won’t be included in your totals, carbon balance and KPIs . We recognise that having large changing emissions year on year can mask the smaller practice changes that are occurring on farms to reduce emissions and have decided to report emissions/ removals from LUC separately for those who need to report this information to their supply chain. This value can be found at the near the top of your report summary (red box in the image below)
You are able to log multiple areas that have undergone land use change on your farm. If you have had multiple changes on different areas of land your results will look a bit different depending on when each land use change occurred.
See the graph below which highlights a report with multiple LUC transitions. The detail of each each transition is written below each graph.
If you have any queries, get in touch at [email protected]
Organic Soils
The LUC tab cannot model land use changes on organic soils. This is due to the distinct way organic soils (e.g. peat) are treated when estimating carbon emissions or removals, as their carbon storage and response to land management differ significantly from mineral soils. Organic soils have a much higher carbon content and are highly sensitive to practices like draining and rewetting.
To account for organic soils that are on your farm, use the options in the Sequestration tab to either account for an area of cultivated peat (known as Histosols) soils or uncultivated peatland soils.
For cultivated soils, if you roughly know the carbon content (e.g. low ~20% soil organic carbon, medium ~35% soil organic carbon or high ~75% soil organic carbon) you can chose the appropriate category, however there is an option if you don't.
Or you can account for areas of uncultivated peat soils on your land, under different land types, e.g. cropland, grassland, fen, bog and by their drainage status. These are tier 2 (UK specific) peatland factors that apply an annual emission/removals factor as recommended by IPCC methodologies. If you are undertaking peatland restoration projects on your land we would recommend changing the peatland option in the year when it reaches the new peatland status.
Wetlands on mineral soils
The LUC tab does not currently account for conversion to or from wetlands, for example the creation or removal of wetland habitats, ditches or ponds on farms. This is because the IPCC 2019 guidance currently doesn't provide a method for estimating CO2 for this conversion due to insufficient data and also notes for CH4 emissions estimates, there is insufficient information to provide emissions factors for recently constructed ponds and ditches and suggests using emissions factors for land that has been flooded for >20 years. This may be updated in future to align with updated evidence.
However, if part of your land is classified as Gleysols (WRB classification), this falls under the IPCC soil category of Wetlands mineral soils. Gleysols are characterized by their waterlogged conditions and the presence of gleying (bluish-gray or greenish-gray color due to iron reduction) resulting from prolonged saturation. This is a different type of soil compared to organic Histosols soils which are commonly found in peatland wetland areas such as bogs marshes or fens (which can be confusing!)
For land use change on gleysols, you can use the land use change calculator, bearing in mind that the land types can only be Cropland, Grassland or Woodlands on these soils, which are being converted to another one of these land uses, but not currently to or from Wetland habitats (e.g. creation or removal of ponds).
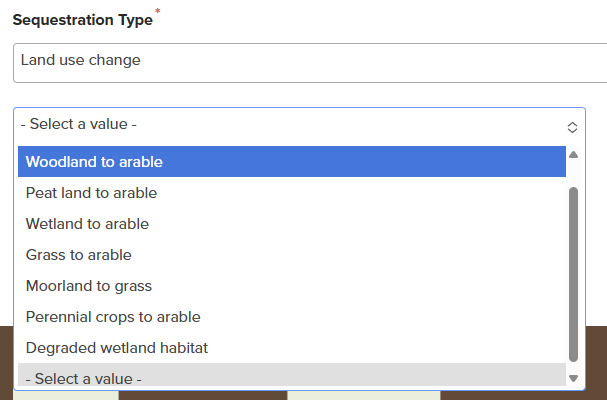
The previous land use change emissions in the calculator could be found in the Sequestration tab (see below). These items have been discontinued, meaning you are unable to add them into new reports, however they will remain unchanged in old reports.
If you are still within a 20 year window of when a major land use change occured on your land, we would recommend removing the legacy land use change options and entering the information under the new LUC tab. To make it easier for creating the following years report, you can copy a report, amend the end date and the emissions/ removals from the LUC tab will update automatically.